![]()
![]()
![]()
![]()
![]()
![]()
![]()
![]()
REVESCO. Revista de Estudios Cooperativos. ARTÍCULOS
e-ISSN: 1985-8031
Ricardo Nahuel Valenzuela Antezana
Universidad Nacional
del Altiplano – Escuela de Posgrado (Perú) ![]()
![]()
Tomás Véliz Quispe
Universidad Nacional
del Altiplano – Escuela de Posgrado (Perú) ![]()
![]()
https://dx.doi.org/10.5209/REVE.96466 Recibido: 26/12/2023 • Aceptado: 04/06/2024 • Publicado: 26/06/2024
ES Resumen. Las cooperativas agrarias han contribuido y vienen contribuyendo a la dinámica económica en sus territorios, en el sur del Perú el café orgánico tiene gran demanda, es por ello que el objetivo del estudio es determinar los procesos críticos de la cadena de valor del café orgánico y su relación con la competitividad en las cooperativas agrarias cafetaleras. La metodología utilizada fue de enfoque mixto, de tipo descriptiva correlacional transaccional y caso de estudio, los resultados indican que la cadena de valor está compuesta por los eslabones producción, acopio, transformación y transformación, el nivel de la cadena de valor de las cooperativas es 40% regular, 50% bajo, 10% muy bajo, respecto a la competitividad un 10% de las cooperativas es muy baja, 70% es baja, 10% es regular y solo 10% alta, la relación entre la cadena de valor y competitividad es significativa, tienen alta codependencia positiva, los procesos críticos en la cadena de valor son: producción, acopio, transformación y comercialización, se propone que las cooperativas Tupac Amaru e Inambari, realicen sus actividades de forma independientes y puedan comercializar sus productos a nivel nacional e internacional. Se concluye que la cadena de valor del café orgánico del sur de Perú no está fortalecida, ya que no hay cooperativas con un nivel alto o muy alto, la demanda de café es mayor a la oferta, solo la cooperativa San Juan del Oro tiene una competitividad alta, CECOVASA regular, y el 70% tienen competitividad baja o muy baja, las dimensiones de menor nivel son: medio ambiente, gestión financiera, asociatividad y institucionalidad, y estrategia empresarial, el estado tiene una relación negativa, notándose que su participación para mejorar la competitividad de las cooperativas no es efectiva, el acceso a las fincas cafetaleras también es deficiente. Las cooperativas, los gobiernos locales, el gobierno nacional, organizaciones no gubernamentales, y cooperación internacional, deben fortalecer dimensiones de menor nivel para fortalecer la cadena de valor de café y mejorar su competitividad.
Palabras clave. Cacao, cadena productiva, ecológico, Puno, pequeños productores, estado.
Claves Econlit. D71, J54, P13, Q13.
ENG Value chain and competitiveness of organic coffee in the agricultural cooperatives of southern Peru
ENG Abstract. Agricultural cooperatives have been contributing to the economic dynamics in their territories. In southern Peru, organic coffee is in great demand. Therefore, the study objective is to determine the critical processes of the organic coffee value chain and its relationship with the competitiveness of coffee agricultural cooperatives. The methodology used was a mixed approach of descriptive, correlational, cross-sectional, and case-study type. The results indicate that the value chain is production, collection, conversion, and marketing links. The cooperatives' value chain level is 40% fair, 50% low, and 10% very low. Regarding competitiveness, 10% of the cooperatives are very low, 70% are low, 10% are fair, and only 10% are high. The value chain and competitiveness relationship are significant; they have a high positive co-dependence. The critical processes in the value chain are production, collection, conversion, and marketing. It is proposed that the Tupac Amaru and Inambari cooperatives carry out their activities independently and market their products nationally and internationally. The conclusion is that the organic coffee value chain in southern Peru is not strong, as there are no cooperatives with a high or very high level. The demand for coffee is greater than the supply. Only the San Juan del Oro cooperative has a high level of competitiveness; CECOVASA, regular; and 70% have low or very low competitiveness. The lowest-level dimensions are environment, financial management, associativity and institutionality, and business strategy. The state has a negative relationship, showing that its participation in improving the competitiveness of cooperatives is not effective; access to coffee farms is also deficient. Cooperatives, local governments, the national government, non-governmental organizations, and international cooperation should strengthen lower-level dimensions to enhance the coffee value chain and improve its competitiveness.
Keywords. Cocoa, productive chain, ecological, Puno, small producers, state.
Summary. 1. Introduction. 2. Literature review. 3. Methodology. 4. Results. 5. Conclusions. 6. References.
How to cite: Valenzuela Antezana, R. N. & Véliz Quispe, T. (2024). Value chain and competitiveness of organic coffee in the agricultural cooperatives of southern Peru. REVESCO. Revista de Estudios Cooperativos, 147(1), 1-18, e96466. https://dx.doi.org/10.5209/REVE.96466.
Coffee is the most popular beverage in the world after water (Hailu, 2015; Barbin et al., 2014), becoming an agricultural product of global importance (Gutiérrez-Calle et al., 2021). Peru is the ninth-largest exporter of coffee in the world (International Coffee Organization, 2020), with a cultivated area of 427 433 hectares (MIDAGRI, 2022), of which 140 285 hectares (32.82%) are organically certified. As a result, Peru is the second largest producer of organic coffee in the world, just below Ethiopia in 2020 (Castillo Hijar, 2022).
In recent years, consumer concerns about the environment have been growing. For this reason, there is a trend to consume organic food (Pedersen et al., 2022; Van Tran & Nguyen, 2021; Zheng et al., 2019). Therefore, there is a growing demand for organic coffee in the world. The Amazonian area of southern Peru is one of the main coffee-producing areas (Garambel-Acurio et al., 2022), representing a product that generates economic dynamics. Coffee agricultural cooperatives have been the main stakeholders in this dynamic since 1970, exporting coffee from the Puno region, and developing a value chain that has evolved over the years.
Studies to determine coffee competitiveness have been developed in South Africa (Bahta, 2021), Colombia (Cerquera et al., 2020), and Spain (Moyano et al., 2008), identifying determinants of competitiveness. Also, Durán & Alcívar (2020) studied the passion fruit value chain, proposing strategies for farmers to obtain higher income from their sales. Robles et al. (2018) characterized the corn value chain by analyzing production behavior and identifying the value chain links, sustainability attributes, and governance. In Saudi Arabia, this coffee acculturation was due to the diversification and reinforcement of sustainable economics in the coffee value chain from farm to cup. In Ethiopia, Assefa Gashaw et al. (2018) analyzed the coffee value chain revealing the direct stakeholders identified in the coffee value chain. In Peru, they investigated the Peruvian cocoa value chain's shortcomings (Garambel-Acurio et al., 2022), the coffee value chain has been little studied. The most relevant antecedent was carried out by Nahuamel (2018) who studied the competitive factors for the development of Peruvian coffee growing. Barrera et al. (2019) stated that the lack of knowledge of the production chain could affect competitiveness. Therefore, to fill this knowledge gap, this research aims to determine the critical processes of the organic coffee value chain and their relationship with competitiveness in coffee agricultural cooperatives in the Puno region.
2.1. Value chain
Benavides (2019) states that the purpose of value chains is to generate more competitiveness, lower production costs, superior quality, variety of inputs, and constant learning, which continuously contribute to innovation, where it is vital to keep coordination within the chain to ensure good organization and distribution of functions. For Bammann (2007), the value chain should represent agribusiness development playing a role in rural poverty reduction, where governments must understand and be able to create favorable conditions for agribusiness and, at the same time, monitor and take the necessary measures to protect and improve the livelihoods of smallholder farmers and other members of rural and urban communities that may be affected by agribusiness development. According to Swisher et al. (2018), value chains can improve agricultural sustainability for rural populations and reduce food insecurity and inequalities.
Cayeros et al. (2016) mention that the value chain approach is relevant in the field of local development since the participants handle specific information on the market for the product they are working with, identify end clients, and implement strategies to ensure quality (Kant et al., 2022). They are more competitive when all stakeholders have developed efficient and collaborative relationships among themselves, coordinate and share information, and, even though they have different interests, they share a common vision of chain development, produce according to market demand, differentiate themselves by making quality and innovative products, take advantage of market opportunities, and are efficient in their costs.
2.2. Competitiveness
M. Porter (1998) was one of the first to define competitiveness regarding a country; he indicates that it is given by the productivity with which it uses its human, economic, and natural resources. This productivity depends on the value of the products and services of a country, measured by the prices paid for the efficiency with which they can be produced, and the more competitive a country is, the better the standard of living for all its citizens. Therefore, the great challenge for all countries is to improve in the race for competitiveness permanently. This author also defines competitiveness at the institutional business level as an organization’s capacity, whether public or private, profit or non-profit, to achieve and maintain advantages that allow it to consolidate and improve its position in the socioeconomic environment in which it operates. These advantages are defined by the organization’s resources and abilities to obtain higher returns than its competitors.
The theory of structural competitiveness, defined by the Organization for Economic Cooperation and Development (OECD) in 2002, was also coined. It proposes competitiveness as the result of the successful management of companies, also considering the strength and efficiency of the national productive structure, long-term trends in the rate and structure of investment, technical infrastructure, and other external determinants. Hernandez (2002) defines competitiveness with a focus on the production chain as a system of integrated agricultural businesses that express the sum of all activities related to agricultural production, the treatment or processing of products (agribusinesses), and their marketing as a single production chain or multivariable or multidirectional value chain.
For Martínez Arroyo et al. (2019), competitiveness emerges as a concept of vital importance for organizations influenced by globalization, which seek strategies that lead to competitive advantages. These are more related to quality and environmental management than customers and suppliers (Birkenberg & Birner, 2018; Venus et al., 2024). In recent years, globalization and innovation have stimulated the search for competitiveness and sustainability in organizations (Ramírez Molina et al., 2021). Thus, Vivar-Astudillo et al. (2020) indicate that activities should be implemented in value chains to generate competitive advantage to increase product value and optimize production processes in the value chain.
For Pulido & Klein (2005), productivity regarding other entities in the environment, and maintaining permanent innovation at all levels are vital to improving competitiveness. Carro & González Gómez (2012) define productivity as the improvement of the productive process. This improvement means a favorable comparison between the number of resources used and the amount of goods and services produced. The weak institutional framework does not contribute to sustainable growth (Arroyo, 2020). Regarding associativity, IICA et al. (2013) are important for strengthening organizations and market focus, being a strategic element to improve associative management. Business management and business strategy are key to competitiveness improvement (Aguilera Enríquez et al., 2011).
For Briones Caicedo et al. (2017) and Berrio et al. (2017), financial management is important for the competitiveness of organizations. This considers maximizing profits, being dynamic in the financial system, savings, and proper management of resources, and together with economic and social factors, are closely related to competitiveness (Luisa et al., 2017). The environment and environmental management is an opportunity to undertake or improve business with high competitiveness (Hernandez-Aguilera et al., 2018). This aspect does not have much importance (Ordóñez, 2017; M. E. Porter & Linde, 1997; Claver Cortés & Molina Azorín, 2000).
2.3. Agriculture and coffee value chain
The global agricultural industry has faced major changes since World War II, from shifts in consumer preferences to productivity improvements in domestic and international markets. Djanian & Ferreira (2020) identified four trends that could influence the direction of the agricultural sector in the coming years for better and worse: we will eat differently, stock up in different places, produce food differently, and trade differently. Advances in agricultural technology will increase transparency and traceability throughout the value chain; we will trade under different rules. Also, contemporary agriculture is increasingly moving towards the synergistic adoption of technologies such as the Internet of Things, the Internet of agriculture, big data analytics, and blockchain to combine resource protection and economic, social, and environmental sustainability (Scuderi et al., 2022).
For Minten et al. (2019), in Africa, during the last decade, there have been important changes in the coffee sector, as evidenced by the increasing adoption of improved production, harvest, and post-harvest practices. Marketing has also improved and investments in processing capacity have been made, as evidenced by the expansion of wet mill coverage. These improved practices are associated with positive effects on coffee productivity and prices; the changes appear to be related to multiple factors, such as local market reform, the increased presence of public extension agents, and the promotion of certification by international buyers.
Vicol et al. (2018) state that value chain upgrading interventions have emerged in recent years as a dominant approach to rural development. In coffee value chains, opportunities for upgrading come from increased consumption of specialty coffees, which roasting companies associate with direct engagement with producing communities, along with an apparent increased commitment to social responsibility. These interventions are aligned with a value chain approach to development and are promoted as upgrading opportunities for otherwise marginalized rural communities.
For Silva et al. (2018), the trend in the coffee value chain is that end consumers are interested in higher-quality products and unique experiences. Therefore, value chain agents should focus on developing cooperative relationships along the chain to offer opportunities to increase the value of use. There is also a movement in the value chain called the third wave which represents an opportunity for small and medium producers who do not produce on a large scale and have difficulty competing in the first and second wave. This third wave is characterized by increased cooperative relationship efforts among chain agents seeking to offer exclusive experiences like an opportunity to support loyalty among chain agents, which would increase the prices and margins of the agents that promise valuable experiences to end consumers.
Clay et al. (2018) indicate that there is little producer participation and voice in coffee value chain governance structures in Africa, which is common in many export agriculture sectors in the developing world (as is the case in Latin America) and has led to low farm-gate prices, restricted competition and little incentive for producers to invest human and capital resources in improving coffee production. Smallholder farmers are "pushed" to produce out of necessity (to avoid poverty). Large-scale farmers are "pushed" to produce solely for the lure of higher profit margins, which they only achieve when producer prices are higher. They conclude that greater inclusion of producers in the price negotiation process and adopting a minimum price formula that includes the real cost of production would improve producers' quality of life.
2.3.1. Coffee Value Chain in Peru
In Peru, according to MIDAGRI (2022), coffee production has been decreasing in recent years with an average of -9.67% per year. This is a consequence of factors, such as yellow rust, low prices, and change to more profitable crops and activities. The regions with the greatest decrease are Piura and Cusco; the only regions with a positive variation are Cajamarca, Loreto, and Pasco. Table 1 shows the surface area in hectares harvested per region in Peru.
Table. 1. Area of coffee harvested in Peru by region.
|
Region |
2019 |
2020 |
2021 |
2022 |
% Average variation |
|
Amazonas |
54,225 |
58,216 |
55,245 |
49,662 |
-2.62 |
|
Ayacucho |
5,846 |
5,549 |
3,515 |
3,879 |
-10.46 |
|
Cajamarca |
64,908 |
65,691 |
69,523 |
76,760 |
5.82 |
|
Cusco |
54,214 |
58,765 |
58,662 |
27,661 |
-14.88 |
|
Huancavelica |
10 |
2 |
- |
5 |
* |
|
Huánuco |
20,752 |
21,048 |
21,112 |
12,530 |
-12.97 |
|
Junín |
94,913 |
90,398 |
89,490 |
66,215 |
-10.59 |
|
La Libertad |
204 |
209 |
204 |
199 |
-0.80 |
|
Lambayeque |
2,397 |
2,397 |
2,397 |
2,215 |
-2.53 |
|
Loreto |
176 |
176 |
176 |
194 |
3.41 |
|
Madre de Dios |
29 |
29 |
28 |
29 |
0.04 |
|
Pasco |
12,124 |
17,392 |
17,880 |
18,160 |
15.94 |
|
Piura |
8,239 |
8,289 |
8,289 |
4,165 |
-16.38 |
|
Puno |
10,972 |
10,972 |
10,968 |
7,924 |
-9.26 |
|
San Martín |
93,987 |
77,248 |
74,373 |
70,381 |
-8.97 |
|
Ucayali |
15,181 |
14,438 |
15,572 |
14,606 |
-1.08 |
|
Total Peru |
438,177 |
430,820 |
427,433 |
313,941 |
-9.67 |
* Not calculated because the data are not significant.
Source: adapted from MIDAGRI (2022).
2.4. Cooperatives
Cooperatives originated in Europe. In Spain, agricultural cooperatives began their activities in the 19th century. Farmers were grouped to form an agricultural community, and later, the 1999 Cooperatives Law was enacted, creating the legal regime for cooperatives in Spain (Ferrer, 2019). In the United States, public support for cooperatives is considered to include beneficial tax treatment, access to favorable credit terms, limited immunity from antitrust laws, and free technical assistance (Sexton & Iskow, 2021).
According to Quispe (2022), cooperatives can be considered one of the main engines of economic and social development in the world, operating under a vision of solidarity. They have a socioeconomic system where people associate voluntarily to work and obtain common benefits. The key factors to achieve sustainable development in cooperatives are planning, organization, personnel integration, management, and control. Llanes Guerra et al. (2019) consider that agricultural cooperatives contribute to local and community development and the improvement of the cooperative's management. The main challenges are cooperative principles, economic and productive management, equity relations, and environmental protection.
2.4.1. Agricultural cooperatives
Agricultural cooperatives are considered an organizational model that allows for improving production and marketing conditions for their products, generating income and substantial changes in their members. Some cooperatives develop business models of social inclusion with the small producers that make up them (Marcela Maestre Matos et al., 2019). Agricultural cooperatives contribute to territorial development, largely supported by public policy, allowing the competitive linkage of the territory with markets but protecting local production systems from being absorbed and diluted within the scheme of transnational capital. At the same time, they favor endogenous innovation capacities and the construction of local social capital and networks that are the basis for development strategies (Rodríguez Miranda, 2021).
For Perdigón Llanes (2020), agricultural cooperatives play an important role in the production and distribution of food. However, they lack the application of digital technologies in the commercial relations of these organizations, which influence technological innovation and the competitiveness of agricultural cooperatives. Also, according to Arias Salazar (2019), the main factors limiting the marketing process of cooperatives are the losses of the products produced by the cooperatives, breaches of contracts by the companies, the availability of timely inputs, as well as the high prices paid by the cooperatives for productive inputs and for the productive services they receive from the state-owned companies.
Agricultural cooperatives can promote technology adoption in agricultural production, which, in turn, increases crop productivity and farmers' incomes (Zhang et al., 2020). In developing countries, agricultural cooperatives are increasingly used to promote improved technologies and alleviate food insecurity and poverty. There is also a need for policies that promote agricultural organizations, such as cooperatives, together with effective extension services for greater and faster adoption of improved technologies (Manda et al., 2020).
3.1. Population and sample
The population is made up of 10 coffee agricultural cooperatives (CAC) in the Puno region, which are: CAC Unión Azata, CAC San Ignacio, CAC Charuyo, CAC San Isidro, CAC Alto Inambari, CAC Tupac Amaru, CAC San Jorge, CAC Valle Grande, Central de Cooperativas Agrarias Cafetaleras de los Valles de Sandia - CECOVASA LTDA (groups the above as a second level organization) and CAC San Juan del Oro. These are all the coffee farmer organizations that carry out significant economic activity in the Puno region.
No sampling was carried out because the sample was census-based. The study was conducted among 10 leading producers or managers of the following cooperatives: CAC Unión Azata, CAC San Ignacio, CAC Charuyo, CAC San Isidro, CAC Alto Inambari, CAC Tupac Amaru, CAC San Jorge, CAC Valle Grande, CAC San Juan del Oro, and CECOVASA LTDA.
3.2. Instrument
An adaptation of the instrument used by Cabera et al. (2011) in Colombia was made, and, based on the interview conducted, the researcher's experience, and the literature review, this adaptation was improved to the reality of the coffee agricultural cooperatives in the Puno region. The Likert scale was used to understand better the results in 5 levels. The instrument was validated by expert judgment, considering the following criteria: clarity, objectivity, updating, organization, structural coherence, semantic coherence, theoretical consistency, methodology, formal structure, and originality, under the methodology used by Magno Cutipa-Limache et al. (2020). The instrument reliability for the value chain and competitiveness variables was calculated with Jamovi 2.3.21 software using Cronbach's alpha coefficient (α). The Cronbach's α coefficient is 93.7% for the value chain variable (18 items) and 95.9% for the competitiveness variable (33 items). Therefore, the instrument is highly reliable (López-García et al., 2003; Maroco & Garcia-Marques, 2006; Oviedo & Campo-Arias, 2005; Rodríguez-Rodríguez & Reguant-Álvarez, 2020).
For the assessment of variables and dimensions, the scale methodology used by de la Fuente et al. (2015) and Vicente-Herrero et al. (2018) was applied, calculating the total sum per dimension and variable, which is detailed in Table 2; a 5-level scale was also used to qualify the variables and dimensions.
Table. 2. Rating scale of variables and dimensions
|
Value Chain |
Competitiveness |
Dimensions (6 items) |
Dimensions (3 items) |
||
|
Level |
Range |
Level |
Range |
Level |
Range |
|
Very low |
[18 to 32] |
Very low |
[6 to 10] |
Very low |
[3 to 4] |
|
Low |
[33 to 46] |
Low |
[11 to 15] |
Low |
[5 to 7] |
|
Medium |
[47 to 61] |
Medium |
[16 to 20] |
Medium |
[8 to 10] |
|
High |
[62 to 76] |
High |
[21 to 25] |
High |
[11 to 13] |
|
Very High |
[77 to 90] |
Very High |
[26 to 30] |
Very High |
[14 to 15] |
Source: own elaboration
3.3. Description of the current situation of the organic coffee value chain in coffee agricultural cooperatives
To identify the current situation of the coffee value chain, a bibliographic and documentary review was carried out, the instrument applied to the executives and managers of organizations was used, and an interview with the experts was also carried out. Finally, to describe the value chain, Porter's methodology (M. Porter, 1998) was used for the value chain model proposed by this author.
3.4. Determination of the competitiveness, critical processes of the value chain, and the relationships between the value chain, competitiveness, and its dimensions of organic coffee in coffee agricultural cooperatives
After applying the instrument to the executives and managers of the coffee agricultural cooperatives, the information was processed using the Jamovi 2.3.21 software, applying descriptive statistics analysis and Spearman's correlation coefficient test according to the methodology and recommendations of several authors (Mendivelso, 2021; Ortiz Pinilla et al., 2021; Restrepo et al., 2007) to determine the critical processes of the value chain and their relationship to competitiveness (Nahuamel, 2018; Cabera et al., 2011).
To determine the relationship between the value chain and competitiveness variables with a 95% confidence level, the null hypothesis (p>0.05) indicates that there is no relationship between the value chain and competitiveness, and the alternate hypothesis (p<0.05) states that there is a relationship between the value chain and competitiveness.
To determine if there is a relationship between the dimensions and the variables, the following hypothesis test was used with a 95% confidence level: the null hypothesis (p>0.05), there is no relationship between the dimensions and the variable; the alternate hypothesis (p<0.05), there is a relationship between the dimensions and the variable.
3.5. Development of an organic coffee value chain model to improve the competitiveness of coffee agricultural cooperatives
Based on the determination of the critical processes of the value chain that affect the competitiveness of the organic coffee value chain, applied interviews, the experience of the researchers, and the bibliographic review, the current model of the organic coffee value chain was elaborated. Likewise, a value chain model was proposed to improve the competitiveness of coffee producer organizations in the Puno region.
4.1. Current situation of the organic coffee value chain in coffee agricultural cooperatives
4.1.1. Organic coffee value chain (own model)
For the coffee organizations in the Puno region, the organic coffee value chain consists of the following links: production, collection, processing, and trading. A summary is shown in Figure 1.
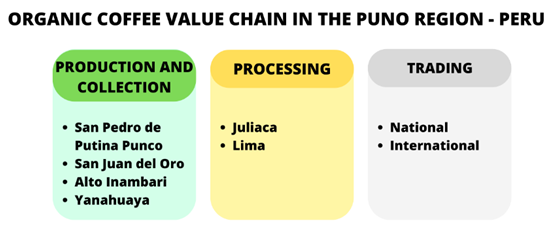
Figure 1: Organic coffee value chain in the Puno region
4.1.1.1. Production
The production of organic coffee is divided per altitude range, being these: low altitude, medium altitude, and high altitude. The cultivated species is Arabica. However, several varieties have been cultivated over the years such as Típica, Marseillaise, Catimor, Bourbon, Geisha, Catuai, Limani, and Costa Rica 95, among others. The production districts are Alto Inambari, San Pedro de Putina Punco, San Juan del Oro, and Yanahuaya.
Table. 3. Production of the coffee agricultural cooperatives in the Puno region
|
|
Year (campaign) – quintals of coffee |
% Average variation |
|||
|
Cooperative |
2019 |
2020 |
2021 |
2022 |
|
|
CAC Tupac Amaru |
1,164.16 |
868.07 |
395.73 |
234.58 |
-40.19 |
|
CAC Inambari |
2,702.88 |
2,632.44 |
2,383.44 |
1,222.30 |
-20.26 |
|
CAC San Isidro |
1,357.70 |
1,726.36 |
1,629.43 |
875.86 |
-8.24 |
|
CAC Charuyo |
1,573.63 |
2,239.57 |
1,660.14 |
1,515.54 |
2.58 |
|
CAC San Ignacio |
990.93 |
1,334.30 |
1,050.66 |
1,013.91 |
3.30 |
|
CAC Union Azata |
708.96 |
945.13 |
629.34 |
592.66 |
-1.98 |
|
CAC San Jorge |
604.05 |
1,024.51 |
756.74 |
764.38 |
14.83 |
|
CAC Valle Grande |
192.05 |
103.39 |
124.23 |
82.07 |
-19.98 |
|
CECOVASA |
9,284.36 |
10,873.77 |
8,663.26 |
6,311.28 |
-10.12 |
|
CAC San Juan del Oro |
12,000.00 |
8,000.00 |
7,000.00 |
5,920.00 |
-20.42 |
|
Total Puno Cooperatives |
30,578.72 |
29,747.54 |
24,292.97 |
18,532.58 |
-14.92 |
Source: own elaboration
4.1.1.2. Collection
There are collection centers strategically distributed in the production valleys and mainly near the coffee agricultural cooperatives. There are several collection centers, and, then, centralized collection centers and transportation to the parchment coffee processing plants. The following are the collection centers: Putina Punco collection center, San Juan del Oro collection center, Yanahuaya collection center, Quiquira collection center, and Massiapo collection center.
4.1.1.3. Processing
The processing of parchment coffee to green coffee is carried out in Juliaca in the case of CECOVASA. In the case of C.A.C. San Juan del Oro, in Lima. Two types of conversion are carried out: the first is to process the parchment coffee collected in the production valleys into exportable green coffee and the other is to roast and grind the green coffee for marketing at the national level. Figure 2 shows the flow diagrams for each type of conversion.
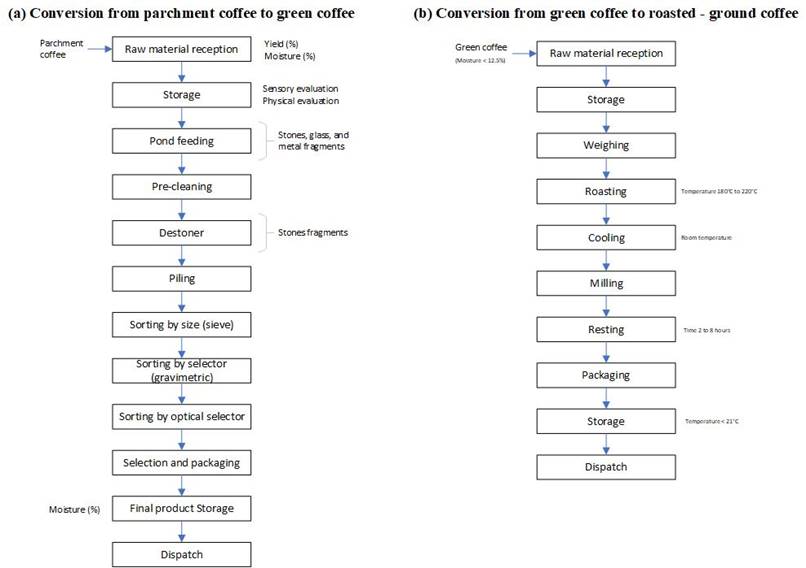
Figure 2: Coffee conversion.
4.1.1.4. Trading
Trading is done internationally and nationally for both green coffee and roasted coffee. The most important international markets are the United Kingdom and the United States; at the national level, the most important market is Lima, the country’s capital. Local consumption is still incipient and growing.
4.1.2. Organic coffee value chain (according to Michael Poter's methodology)
This methodology has been widely applied (Assefa et al., 2022; Moreno Castillo et al., 2018; Peña et al., 2008). It describes the value chain in primary or essential activities (internal logistics, operations, external logistics, marketing and sales, after-sales services) and support activities (infrastructure, human resources, technological development, procurement - purchasing), allowing a detailed description. Figure 3 shows Porter's model, the model adaptation is detailed below:
4.1.2.1. Primary Activities
4.1.2.1.1. Internal logistics
There are different internal logistics activities in the coffee agricultural cooperatives, including activities such as the provision of seeds, fertilizers, bags, and sacks, transportation to the collection center, transportation to the central collection centers, transportation to the processing plants, and shipment of products to domestic and foreign markets.
4.1.2.1.2. Operations
The main operations are, in the case of cooperatives, in the production zones (Tambopata Valley and Inambari); in the case of the exporting cooperatives (CECOVASA and CAC San Juan del Oro), they carry out collection, conversion, and marketing operations at the national and mainly international level, especially exports to Europe and the United States.
4.1.2.1.3. External logistics
External logistics is related to transportation for foreign and domestic trade and foreign importers. In the domestic market, there is a presence of intermediaries; also in the collection, there is a presence of intermediaries through domestic and foreign companies.
4.1.2.1.4. Marketing and sales
Marketing and sales are carried out mainly for sales at the national level; at the international level, the product is in high demand, so these activities are rarely carried out, especially because there is more demand than supply.
4.1.2.1.5. After-sales services
After-sale services are performed until the product quality is validated at the destination in the case of foreign sales. In the case of disputes, quality control of counter-samples and the subsequent validation or negotiation of the contract are performed. In the case of domestic products, conversion plants have a customer service area, which conducts the follow-up and corrective actions for after-sale incidents due to their quality systems.
4.1.2.2. Support Activities
4.1.2.2.1. Infrastructure
There are infrastructures in the production valleys in the following districts: Alto Inambari, Yanahuaya, San Juan del Oro, and San Pedro de Putina Punco. These belong to the cooperatives and are also used for meetings, and training workshops, among others. In Juliaca city, in the case of CECOVASA, there are facilities for primary conversion (parchment coffee to green coffee) and secondary conversion (roasted and ground).
4.1.2.2.2. Human Resources
Human resources have mostly young and minimally older personnel because salaries or payments are not high enough. There is a very marked and linear hierarchical level, and the activities and duties of the cooperatives' executives are not clearly defined.
4.1.2.2.3. Technological development
Technological development in primary production is still basic, due to the rugged topography of the production areas which hinders the application of current technologies. In the collection process, only computer packages are used; in conversion, there is functional technology, but it is not state-of-the-art.
4.1.2.2.4. Procurement - purchasing
The logistics area of each cooperative coordinates the supply of sacks and containers mainly for coffee, which are usually purchased wholesale in Juliaca or Lima. The exporting cooperatives (CECOVASA and CAC San Juan del Oro) have a collection area where they acquire the raw material (parchment coffee) from their members and keep records of their suppliers.
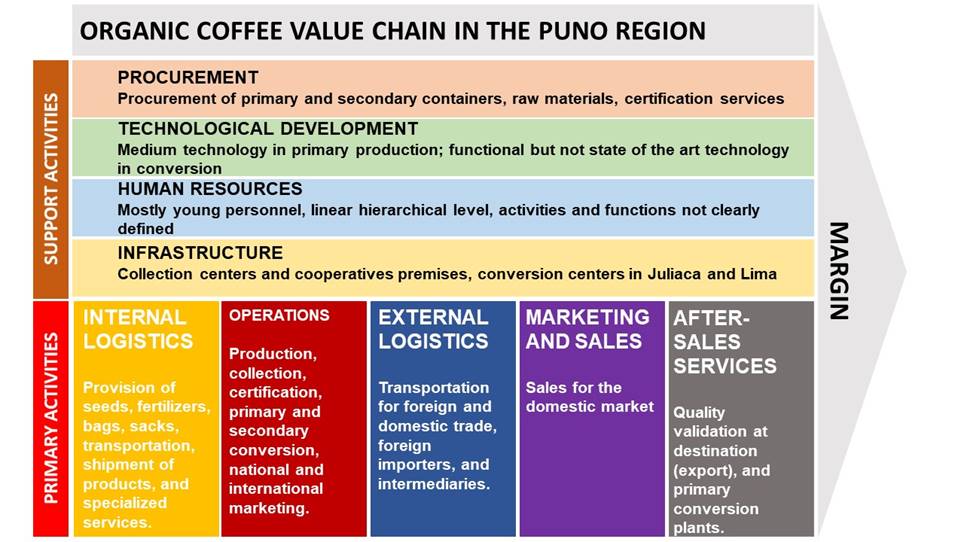 |
Figure 3: Organic coffee value chain in the Puno region (Michael Porter model).
4.1.3. Organic coffee value chain in the coffee agricultural cooperatives of the Puno region (according to application of instrument)
The value chain dimensions they are involved in are production, collection, processing, and trading. The results of the items that make up each dimension were analyzed with descriptive statistics. The value chain level is detailed in Figure 4 (a). It can be seen that the coffee agricultural cooperatives in the Puno region are strengthened at a low level of 50%, a fair level of 40%, and 10% very low. Due to the very low level of the value chain, the last cooperative, CAC Valle Grande, is at risk of ceasing to work. These results indicate that there is work to be done in the value chain dimensions to increase its level to a fair, high, or very high level, which should be done by the cooperatives, local governments, the national government, non-governmental organizations involved, and possible international cooperation.
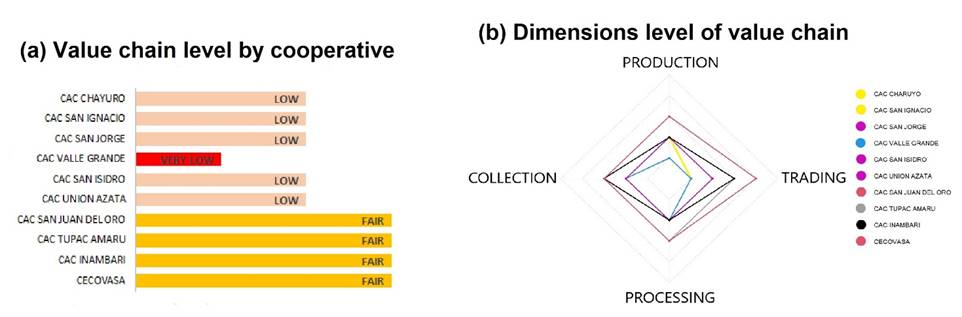
Figure 4: Level of the coffee value chain and dimensions in the coffee agricultural cooperatives of Puno.
With the scale methodology mentioned in this section, the level of productivity, collection, processing, and trading (dimensions) is represented for each cooperative (Figure 4 (b)). In terms of production, only CAC San Juan del Oro and CECOVASA have a fair production level; 80% of the other cooperatives have low production, reflected in the coffee collection. In terms of conversion, only 30% have a fair level (CAC San Juan del Oro, CECOVASA, CAC Tupac Amaru) since they convert coffee at the primary level (green coffee) and secondary level (roasted coffee). There is still a gap regarding coffee conversion since, at the international level, there are improved processes and a greater diversity of coffee-based products. In the marketing link, CAC Chayuro, CAC San Ignacio, and CAC Valle Grande have very low marketing power, that is, they depend completely on CECOVASA or other collectors to market their coffee. CAC San Jorge, CAC Unión Azata, and CAC San Isidro have a low marketing power, having the same dependence to market their products. The Inambari and Tupac Amaru cooperatives have the potential to sell their products independently, thus generating a greater economic movement. Only CAC San Juan del Oro and CECOVASA have high marketing power because they are the only cooperatives that export directly to foreigners.
4.2. Determination of competitiveness, the critical processes of the value chain, and the relationships between the value chain, competitiveness, and its dimensions in coffee agricultural cooperatives
4.2.1. Competitiveness of coffee agricultural cooperatives in the Puno region
The competitiveness dimensions of coffee agricultural cooperatives in the Puno region are technology and innovation, environment, productivity, quality, financial management, associativity and institutionality, business strategy, market and prices, and state and accessibility. The results of the items that make up each dimension were analyzed with descriptive statistics. The competitiveness level of the cooperatives in the Puno region is detailed in Figure 5 (a). The competitiveness of CAC Valle Grande is very low; 70% has a low level; only CECOVASA has a fair level of competitiveness. Finally, the most competitive cooperative in the Puno region with a high level is CAC San Juan del Oro. These results indicate that there is work to be done in the competitiveness dimensions to increase their level to a fair, high, or very high one. This work must be done by the cooperatives, local governments, the national government, non-governmental organizations involved, and possible international cooperation. Romero et al. (2024) indicate that state intervention must be comprehensive, that is, throughout the value chain.
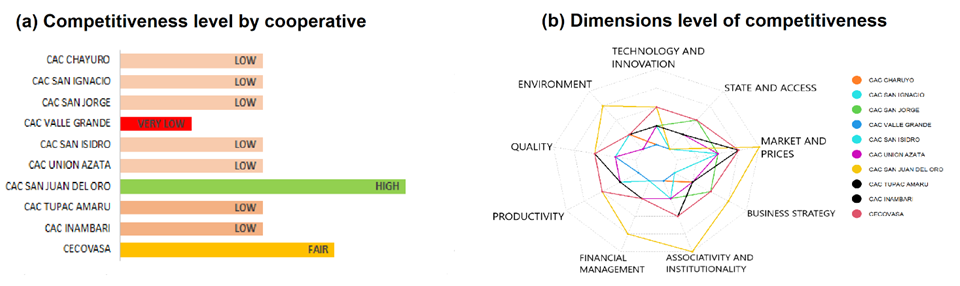 |
Figure 5: Level of the coffee value chain and dimensions in the coffee agricultural cooperatives of Puno
Regarding the dimensions of the competitiveness variable, technology, and innovation are incipient. Only 20% of the cooperatives have a fair level, the remaining 80% have a low and very low level. Concerning the environmental dimension of growing importance in recent years (Arbaiza, 2019), only CAC San Juan del Oro has the relevant certifications with a high level; the other 90% have a low or very low level. The quality level of the coffee cooperatives in the Puno region, according to the accumulated result of the items that make up the dimension, is fair at 50%, and the other 50% is low. The productivity level concerning national data reflects that 80% is low or very low, and only 20% of the cooperatives have a fair level of productivity that allows them to compete and maintain themselves in the market.
Financial management, which is important for the collection and management of resources of the cooperatives (Pérez et al., 2024), has a low or very low level in 90% of the cases. Only CAC San Juan del Oro has a high level because it raises funds from abroad. Something similar occurs with the level of business strategy. This cooperative has a high level because it has an updated and current strategic plan; 70% of cooperatives have a low or very low level; the remaining 20% have a fair level of business strategy.
Associativity and institutionality of coffee cooperatives in the Puno region are low or very low at 50%; 30% have a regular level, namely CAC Alto Inambari, CAC Tupac Amaru, and CECOVASA, which can grow in the market; CAC San Juan del Oro has a very high level of institutionality. The level of market access and prices of 60% of the cooperatives are fair because the coffee from Puno is highly demanded (Valenzuela Antezana & Luna-Mercado, 2023); the remaining 40% has a high or very high level, due to the growing demand for coffee from Puno. Finally, regarding the level of effective government participation and access to the farms, 70% of the cooperatives have low or very low participation; only 30% have fair participation, which means that there is much work to do to ensure that the government has effective participation in the competitiveness of coffee agricultural cooperatives in the Puno region.
4.2.2. Relationship between value chain and competitiveness
The hypotheses were contrasted, and given that the p-value was 0.001 (less than 0.05), the alternative hypothesis indicating a significant relationship between the value chain and the competitiveness of coffee agricultural cooperatives was accepted. Spearman's Rho value is 0.914 (Figure 6), indicating that the correlation is highly positive, i.e., the two variables have a high co-dependence.
4.2.3.1. Critical processes in the organic coffee value chain
A correlation analysis between the value chain dimensions (production, collection, processing, trading) and the competitiveness variable was carried out to determine the critical processes in the value chain and their relationship with competitiveness The results are detailed in Figure 6, indicating that all the dimensions have a significant relationship with competitiveness (p-value<0.05), with a positive and very high level of correlation. Processing is the dimension with the highest correlation, indicating that this dimension contributes more than the others to the competitiveness of the coffee agricultural cooperatives in the Puno region.
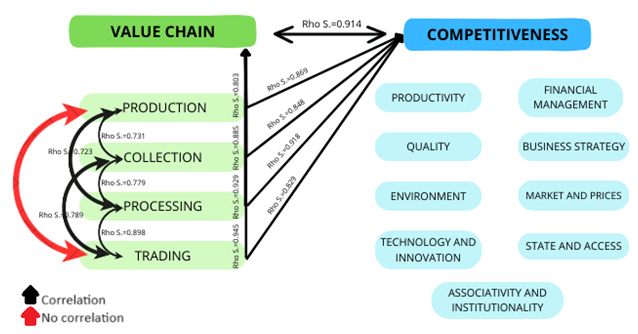 |
Figure 6: Correlation between value chain and competitiveness
When analyzing the relationship between the value chain dimensions (production, collection, processing, trading), the results indicate that all dimensions have a significant relationship, except for the production and trading dimensions (Figure 6). This is attributed to the fact that the demand for the coffee produced in Puno is high and the supply is low, resulting in a demand-supply gap. Therefore, these dimensions are not statistically related. All dimensions are positively correlated, and the relationship is directly proportional; if one improves, the other will also improve. The highest levels of correlation are between the processing and trading dimensions, because the greater the generation of added value, the greater the sales capacity and, therefore, the greater the income for the cooperatives.
4.2.3.2. Value chain dimensions with the value chain variable
The results indicate that there is not a significant relationship between the production and trading dimensions; the other relationships between the production, collection, processing, and trading dimensions, as well as the relationship with the value chain variable, are significant. The correlations are positive in all cases (Figure 6).
4.2.3.3. Competitiveness dimensions with the competitiveness variable
The results indicate that the environment, quality, market, and productivity dimensions have no significant relationship with the business strategy dimension because they have a low level of business strategy, which is carried out in an inertial way in 70% of the cases. The State and access dimension has no significant relationship with the other dimensions of the competitiveness variable (Figure 7). All the relationships have positive correlations, except in the case of the state and access dimension, where the correlations are negative or low, possibly because state policies do not impact competitiveness dimensions significantly. Therefore, they are not effective.
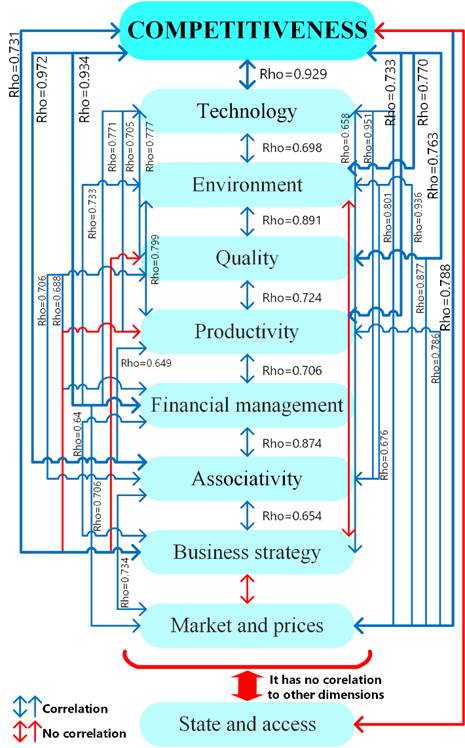
Figure 7: Correlation between competitiveness and competitiveness dimensions
Regarding the interaction of the competitiveness variable with its dimensions, all have a significant relationship with the variable. The state and access dimension is low, despite having a relevant relationship and positive correlation. As previously mentioned, the state actions do not have the expected impact on the competitiveness of the coffee agricultural cooperatives in the Puno region. Thus, it is evident that improvements must be made to the policies related to the value chain and competitiveness of organic coffee.
4.3. Organic coffee value chain model to improve competitiveness in coffee agricultural cooperatives
Based on the results of the previous objectives, this one proposes and compares a value chain model that aims to increase the competitiveness of coffee agricultural cooperatives in the Puno region.
4.3.1. Value chain in the Puno region (current situation)
Figure 8 shows a summary of the organic coffee value chain in the Puno region, which will serve as a reference to propose a model. This figure includes the coffee cooperatives and all the stakeholders involved in this value chain. In the production link, the main protagonists are the coffee producers who occasionally receive technical assistance from the local government, national government entities, and exporting cooperatives (CECOVASA and CAC San Juan del Oro). They also purchase different goods for coffee production. These producers sell their coffee to CAC San Juan del Oro and CECOVASA through their base cooperatives and coffee collectors. The latter purchase the parchment coffee on delivery, unlike the cooperatives that provide an advance payment and then pay the balance. The disparate forms of payment afford collectors the advantage of procuring and selecting superior coffees, as producers prioritize the availability of cash to acquire essential food and other necessities.
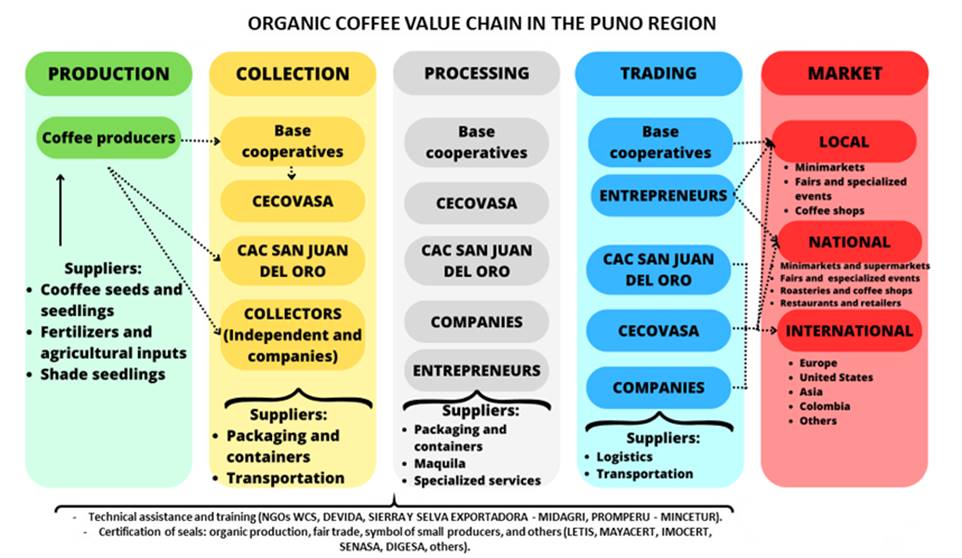 |
Figure 8: Organic coffee value chain in the Puno region.
Regarding the conversion link, cooperatives, companies operating in the Puno region (usually founded by former workers of the cooperatives) and entrepreneurs perform this activity. Two conversion types are performed mainly: primary conversion (from parchment coffee to exportable green coffee) and secondary conversion (from green coffee to roasted coffee). The same stakeholders market these products locally (mainly in the producing districts, the cities of Puno and Juliaca, and tourist destinations in the Puno region), nationally (mainly in Lima and Arequipa), and internationally (mainly in Europe, the United States, and Asia).
The base cooperatives (CAC Tupac Amaru, CAC Inambari, CAC Union Azata, CAC San Jorge, CAC San Isidro, CAC San Ignacio) market their products locally; the entrepreneurs (including winners of coffee quality contests) market their products locally and nationally. At the national level, their clients are retailers, coffee shops, and restaurants, and they attend coffee-related fairs. CECOVASA and CAC San Juan del Oro market coffee at all levels, mainly at the international market, exporting 98% and 95% of their production to this market, respectively. The main market for coffee companies is the domestic market.
4.3.1.1. Production and collection
Coffee producers are the only main stakeholders in the production link. They purchase the necessary inputs for cultivation, such as seeds, coffee seedlings or forest species, fertilizers, and agricultural inputs allowed for organic production. They also receive technical assistance and occasional training, especially before external inspections by organic production certifiers, mainly CECOVASA and CAC San Juan del Oro. During the production campaign, they receive these services from the local government, national government, and non-governmental organizations (NGOs). Note that producers deliver their parchment coffee to the base cooperatives, which are 08 (Figure 9); then, they deliver the product to CECOVASA, which is the central cooperative for subsequent transport and marketing, unlike CAC San Juan del Oro and the collectors, which deliver their parchment coffee directly to the collection centers, warehouses, local fairs and even to the producer's farm in the case of collectors.
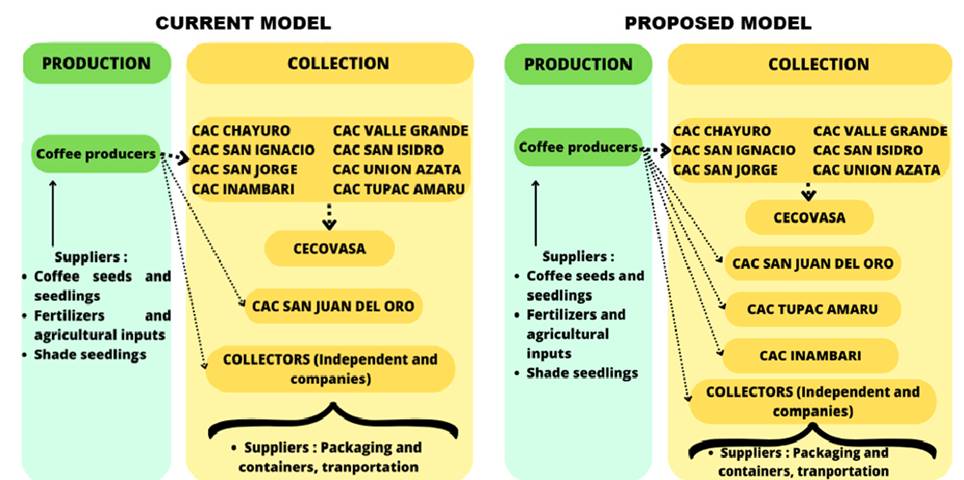 |
Based on the results of the previous objectives, it is considered that no major changes can be made in the production link, except for greater and more effective State participation, both by local governments (provincial and district municipalities, and regional governments) and national governments (ministries and national programs). Regarding collection, it is considered that, because of their strength in the value chain and level of competitiveness, CAC Tupac Amaru and CAC Inambari have the infrastructure, equipment, product quality, and demand to carry out these activities independently from CECOVASA, to generate greater economic activity and also shorten the processes to make them more direct with the coffee producers, so that they can also later carry out the corresponding conversion and marketing, as detailed in Figure 9.
4.3.1.2. Conversion, commercialization and market
Conversion is closely related to commercialization since the stakeholders carry out these two activities as shown in Figure 9. The base cooperatives (CAC Tupac Amaru, CAC Union Azata, CAC San Jorge, CAC Inambari, CAC San Isidro, and CAC San Ignacio) commercialize their products to CECOVASA, which is the 2nd level organization of raw material (parchment coffee), performing only secondary conversion (roasting). These products are mainly marketed at local and regional fairs. In the case of the entrepreneurs, most of whom are producers who have won a prize in a coffee quality contest, they market their products locally and nationally, using trade fairs and events, stores, coffee shops, restaurants, and retailers as their marketing channels. In the case of CECOVASA, CAC San Juan del Oro, and the companies (founded by former workers of the coffee agricultural cooperatives), they sell their products nationally and internationally. The companies sell mostly in the domestic market, and CECOVASA and CAC San Juan del Oro sell mostly in the international market, 98% and 95%, respectively. Other secondary stakeholders are suppliers of containers, packaging, specialized services, logistics, transportation, and maquila. The latter is important because, in the case of CAC San Juan del Oro and some companies, they contract the services of coffee conversion plants to carry out maquila for the subsequent marketing of the products.
The market is mostly international, as represented in Figure 10, and national and local, to a much lesser extent, because in Peru the per capita consumption of coffee is one kilogram, according to the Junta Nacional del Café, unlike countries that import coffee, such as Finland (8.2 kg), Denmark (7.4 kg), Italy (4.9 kg), and United States (3.7 kg), noting that the consumption of coffee in Peru is very low. Thus, it is important to raise this internal consumption of the products grown in the country and its valuation in the territory since, as noted in the consumption, it is more valued abroad than in the country of production.
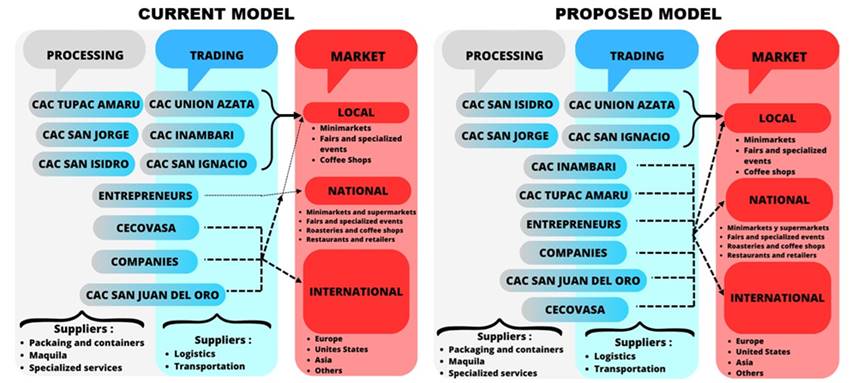 |
The model proposed in these links reaffirms the proposal of the production and collection model that suggests that CAC Inambari and CAC Tupac Amaru carry out their activities independently from CECOVASA, carrying out the processing and trading of their products not only locally but also nationally and internationally. It is also proposed to reduce sales to the international market and increase sales in the national and local markets to generate more economic activity in the country. Likewise, income from sales is available more quickly since, when exporting large quantities, as CECOVASA and CAC San Juan del Oro do, payments are made upon the arrival of the container at the destination and the quality is validated, which takes 2 to 3 months at least. This generates little working capital. Regarding the market, as mentioned above, sales must be increased at the national and local levels and, therefore, sales in the international market must be reduced.
The organic coffee value chain of the coffee cooperatives in the Puno region consists of the following links: production, collection, processing, and trading. In Michael Porter's model, the value chain is composed of support activities, such as procurement (containers, raw materials, certification services, etc.), technological development (medium technology in raw material production, functional but not state-of-the-art technology in processing), human resources (mostly young, hierarchical level lines, functions not clearly defined), infrastructure (collection centers, cooperative premises, processing centers in Juliaca and Lima). The primary activities consist of internal logistics (seed supply, inputs, transportation, specialized services), operations (production, collection, certification, primary and secondary conversion, domestic and international marketing), external logistics (transportation for foreign and domestic trade, foreign importers, intermediaries), marketing and sales (applies to the domestic market) and after-sales services (quality validation at destination, conversion plants). Marketing and sales are not carried out internationally because the products are in high demand, and there is a demand-supply gap for organic coffee produced in Puno.
The value chain level of the coffee cooperatives in the Puno region is 40% fair (CAC San Juan del Oro, CAC Tupac Amaru, CAC Inambari, CECOVASA), 50% low (CAC Charuyo, CAC San Ignacio, CAC San Jorge, CAC San Isidro, CAC Union Azata), and 10% very low (CAC Valle Grande, which is at risk of ceasing to work due to the very low level of its value chain). There are no cooperatives with a high or very high level of the value chain, which indicates that there is still work to be done to improve the dimensions of the value chain. 80% of the cooperatives have low production, and only 30% have a fair conversion level (CAC San Juan del Oro, CECOVASA, CAC Tupan Amaru). In terms of trading, only CAC San Juan del Oro and CECOVASA have a high level because they are the only cooperatives that export coffee, besides collecting and trading the coffee of other cooperatives.
The competitiveness of CAC Valle Grande is very low (70% of cooperatives have a low level); CECOVASA has a fair level of competitiveness; the cooperative with the highest level is CAC San Juan del Oro, so competitiveness dimensions must be improved. This improvement should be carried out by the cooperatives, local governments, the national government, non-governmental organizations involved, and possible international cooperation. Technology and innovation are emerging. Regarding the environment, only CAC San Juan del Oro has environmental certifications, with a high level. The quality level of 50% of the cooperatives is fair; 80% have low or very low productivity; 90% have low or very low financial management; only 10% have a high level of business strategy because they have an updated and current strategic plan; 50% of the coffee cooperatives have low or very low associativity and institutionality; 60% have low or very low market access and prices because the coffee from Puno is in high demand. Regarding government participation and access to farms, 70% of the cooperatives exhibit a low or very low level of participation. This indicates that government interventions are not effective enough in enhancing the competitiveness of cooperatives.
The relationship between the value chain is significant and highly positive, having a high co-dependence, i.e., as the value chain is strengthened, the level of competitiveness increases. The critical processes in the value chain that exhibit a positive relationship with competitiveness are production, collection, conversion, and marketing. Concerning the competitiveness of coffee agricultural cooperatives in the Puno region, all the correlations between the dimensions are positive, except for the state and access dimensions, which are negative or low. This is because the policies applied do not significantly impact the competitiveness dimensions of coffee cooperatives in Puno.
The value chain model for coffee agricultural cooperatives consists of production, collection, conversion, and marketing. The proposed model calls for enhanced state participation in the production link. This may be achieved through the involvement of local governments (provincial and district municipalities, and regional governments) or the national government (ministries and national programs). Regarding collection, it is proposed that, due to their strength in the value chain and competitiveness level, CAC Tupac Amaru and CAC Inambari, which have infrastructure, equipment, product quality, and demand, carry out these activities independently from CECOVASA to generate greater economic activity and also shorten the processes to make them more direct to coffee producers. This proposal implies that in the conversion and marketing links, these cooperatives should also work independently so that their products can be sold locally, nationally, and internationally. Similarly, it is recommended that sales to the international market be reduced and sales to the national and local markets be increased. This would result in greater economic activity in the country and greater availability of working capital.
Further studies of the value chain and competitiveness applied to coffee producers should be carried out, also in coffee agricultural cooperatives in other regions of Peru, comparing them with each other and with cooperatives in other coffee-growing countries. It is recommended that the coffee agricultural cooperatives in the Puno region enhance the dimensions of the value chain and competitiveness. To this end, it is advised that they prioritize the implementation of their strategic plan, which should clearly define the objectives to be achieved in the coming years, as well as prospective studies of these. They should also diversify their production and generate more specialized services in the organic coffee value chain to improve their levels of competitiveness.
Conflict of interest
No conflict of interest of the authors.
RNVA performed the conception, data acquisition, and data analysis; TVQ performed the design and critical revision, both authors interpreted the data, drafted the document, and approved the final version of it.
Aguilera Enríquez, L., González Adame, M., & Rodríguez Camacho, R. (2011). Estrategias empresariales para la competitividad y el crecimiento de las PYMES. Una evidencia empírica. Investigación y Ciencia: de la Universidad Autónoma de Aguascalientes, ISSN-e 1665-4412, No. 53, 2011, Págs. 39-48, 53, 39–48.
Arbaiza, M. (2019). Huella de carbono: importancia y avances en el Perú. Stakeholders, 1(1), 11–11.
Arias Salazar, C. (2019). El proceso de comercialización de productos en cooperativas agropecuarias del municipio Bayamo. Principales factores que limitan su funcionamiento. Revista Estudios del Desarrollo Social: Cuba y América Latina, 7(3).
Arroyo, J. (2020). Débil competitividad e institucionalidad: El crecimiento no sostenible del modelo informal. Latin American Research Review, 55(2), 266–277. https://doi.org/10.25222/LARR.376.
Assefa Gashaw, B., Habteyesus, D. G., & Nedjo, Z. S. (2018). Value Chain Analysis of Coffee in Jimma Zone of Oromia Regional State, Ethiopia. American Based Research Journal, 7(11), 09–17.
Assefa, Z. B., Dinku, A. M., & Jemal, A. M. (2022). Value chain analysis of Mung Bean (Vigna radiata L. Wilczek thrive) in Kalu Woreda, Ethiopia. Agriculture and Food Security, 11(1), 1–14. https://doi.org/10.1186/s40066-022-00393-2.
Bahta, Y. T. (2021). Competitiveness of South Africa’s agri-food commodities. AIMS Agriculture and Food, 6(4), 945–968. https://doi.org/10.3934/agrfood.2021057.
Bammann, H. (2007). Participatory value chain analysis for improved farmer incomes, employment opportunities and food security. Pacific Economic Bulletin, 22(3), 113–125.
Barbin, D. F., de Souza, A. L., Felicio, M., Wen Sun, D., Nixdorf, S. L., & Hirooka, E. O. (2014). Application of infrared spectral techniques on quality and compositional attributes of coffee: An overview. Food Research International, 61, 23–32.
Barrera, V., Alwang, J., Casanova, T., Domínguez, J., Escudero, L., Loor, G., Peña, G., Párraga, J., Arévalo, J., Quiroz, J., Tarqui, O., Plaza, L., Sotomayor, I., Zambrano, F., Rodríguez, G., García, C., & Racines, M. (2019). La cadena de valor de cacao y el bienestar de los productores en la provincia de Manabi-Ecuador (INIAP, Ed.). ARCOIRIS Producciones Gráficas.
Benavides, G. F. (2019). Cadenas de valor y tendencias en innovación en actividades turísticas. Cuadernos Latinoamericanos de Administración, 15(29), 1–16. https://doi.org/10.18270/cuaderlam.v15i29.2872.
Berrio, B. J. D. Á., Pérez, H., & Brito, R. R. V. (2017). Gestión financiera y competitividad de las empresas prestadoras de servicios turísticos en la frontera Colombo – Venezolana. FACE: Revista de La Facultad de Ciencias Económicas y Empresariales, 16(2), 38–53. https://doi.org/10.24054/01204211.V2.N2.2016.2289.
Birkenberg, A., & Birner, R. (2018). The world’s first carbon neutral coffee: Lessons on certification and innovation from a pioneer case in Costa Rica. Journal of Cleaner Production, 189, 485–501. https://doi.org/10.1016/J.JCLEPRO.2018.03.226.
Briones Caicedo, W. R., Morales Intriago, F. L., & Baja˜na Abril, F. J. (2017). Gestión financiera desde la competitividad de las agrícolas de un grupo bananero en las provincias de Guayas y Los Ríos. Journal of Science and Research, 2(8), 16–21. https://doi.org/10.26910/ISSN.2528-8083VOL2ISS8.2017PP16-21.
Cabera, A., López, P., & Ramírez, C. (2011). La competitividad empresarial: un marco conceptual para su estudio (D. de C. y Publicaciones, Ed.; 4ta ed.). Universidad Central.
Carro, R., & González Gómez, D. A. (2012). Productividad y competitividad (1st ed., Vol. 1).
Castillo Hijar, M. E. (2022). La caficultura orgánica peruana (I. Mifflin & L. Castillo, Eds.). Junta Nacional del Café (JNC).
Cayeros, S. E., Robles, F. J., & Soto, E. C. (2016). Cadenas productivas y cadenas de valor. Revista Educateconciencia, 10(11), 6–12.
Cerquera, O., Pérez, V., & Sierra, J. (2020). Análisis de la competitividad de las exportaciones del café del Huila. Revista TENDENCIAS, XXI(2), 19–44. https://doi.org/https://doi.org/10.22267/rtend.202102.139.
Claver Cortés, E., & Molina Azorín, J. F. (2000). Medio ambiente, estrategia empresarial y competitividad. Revista Europea de Dirección y Economía de La Empresa, ISSN 1019-6838, Vol. 9, No 1, 2000, Págs. 119-138, 9(1), 119–138.
Clay, D. C., Bro, A. S., Church, R. A., Ortega, D. L., & Bizoza, A. R. (2018). Farmer incentives and value chain governance: Critical elements to sustainable growth in Rwanda’s coffee sector. Journal of Rural Studies, 63, 200–213. https://doi.org/10.1016/J.JRURSTUD.2018.06.007.
De la Fuente, E. I., García, J., Cañadas, G. A., San Luis, C., Cañadas, G. R., Aguayo, R., de la Fuente, L., & Vargas, C. (2015). Psychometric properties and scales of the Granada Burnout Questionnaire applied to nurses. International Journal of Clinical and Health Psychology, 15(2), 130–138. https://doi.org/10.1016/j.ijchp.2015.01.001.
Djanian, M. (McKinsey), & Ferreira, N. (McKinsey). (2020). Agriculture sector: Preparing for disruption in the food value chain. In Agriculture Practice (pp. 1–9). McKinsey & Company.
Durán, G. M., & Alcívar, J. (2020). La cadena de valor en el proceso agrícola de Maracuyá. ECA Sinergia, 11(2), 108–118. https://doi.org/10.33936/eca_sinergia.v11i2.2415.
Ferrer, S. M. (2019). El sistema de cooperativas agrarias en España: desde el corporativismo hasta la actualidad. Novum Jus, 13(2), 59–80. https://doi.org/10.14718/NOVUMJUS.2019.13.2.4.
Garambel-Acurio, S. I., Lima-Medina, I., Loza-Del Carpio, A., & Checahuari Jarata, S. E. (2022). Incidencia de nematodos asociados a las principales zonas productoras de café en la región Puno, Perú. Bioagro, ISSN-e 2521-9693, ISSN 1316-3361, Vol. 34, No. 1, 2022, Págs. 85-96, 34(1), 85–96. https://doi.org/10.51372/bioagro341.8.
García Pérez, A.M.; Yanes Estévez, V.; Román Cervantes, C. & González Dávila, E. (2024). The strategic behaviour of cooperatives: their adaptive cycle. REVESCO. Revista de Estudios Cooperativos, 146(1), 1-18, e93672. https://dx.doi.org/10.5209/REVE.93672.
Gutiérrez-Calle, S. A., Sánchez-Díaz, R. A., Delgado-Silva, Y. B., Montenegro, J. D., Gutiérrez, D. L., Maicelo-Quintana, J. L., & Guerrero-Abad, J. C. (2021). Capillary electrophoresis as a tool for genotyping SH3 mediated coffee leaf rust resistance. Scientia Agropecuaria, 12(1), 91–99.
Hailu, A. (2015). Identification and Classification of Foreign Materials (Non-Coffee Beans origin) present in Sample Coffee Beans by using Imaging Techniques. Universidad de Haramaya.
Hernandez, J. (2002). Agroexportación - estrategias para lograr competitividad.
Hernandez-Aguilera, J. N., Gómez, M. I., Rodewald, A. D., Rueda, X., Anunu, C., Bennett, R., & van Es, H. M. (2018). Quality as a Driver of Sustainable Agricultural Value Chains: The Case of the Relationship Coffee Model. Business Strategy and the Environment, 27(2), 179–198. https://doi.org/10.1002/BSE.2009.
Hidalgo Romero, P.D.; Pulgar Salazar, M.E. & Coral Guerrero, C.A. (2024). El ADN de la economía popular y solidaria en Ecuador: explorando las características clave de un sistema económico alternativo, REVESCO. Revista de Estudios Cooperativos, 146(1), 1-15, e93671. https://dx.doi.org/10.5209/REVE.93671.
(IICA), I. I. de C. para la A., Amézaga, C., Rodríguez, D., Nuñez, M., Herrera, D., Agrícolas, P. I. C. y S. de C., (ETIT), E. T. I. y T., & (PDTAF), P. de D. T. y A. F. (2013). Orientaciones estratégicas para el fortalecimiento de la gestión asociativa.
International Coffee Organization. (2020). Historical Data on the Global Coffee Trade. Data Base. http://www.ico.org/new_historical.asp.
Kant, S., Zegeye, Z., & Tesfaye, T. (2022). Coffee Supply Operation Management Consequences on Cooperative Societies Functionalism in Ethiopia. Logistic and Operation Management Research (LOMR), 1(2), 40–51. https://doi.org/10.31098/LOMR.V1I2.1056.
Llanes Guerra, O., Martínez Massip, A., García Pedraza, L., Zenea Montejo, M., López Verdecia, Y., Llanes Guerra, O., Martínez Massip, A., García Pedraza, L., Zenea Montejo, M., & López Verdecia, Y. (2019). Evaluación de responsabilidad social en cooperativas agropecuarias. Revista Estudios Del Desarrollo Social: Cuba y América Latina, 7(3).
López-García, E., Banegas, J. R., Pérez-Regadera, A. G., Gutiérrez-Fisac, J. L., Alonso, J., & Rodríguez-Artalejo, F. (2003). Valores de referencia de la versión española del Cuestionario de Salud SF-36 en población adulta de más de 60 años. Medicina Clínica, 120(15), 568–573. https://doi.org/10.1016/S0025-7753(03)73775-0.
Luisa, M., García, S., Elena, M., & Adame, C. (2017). La Gestión Financiera de las PYME en la Ciudad de México y su relación de la competitividad. Contaduría Universidad de Antioquia, 71, 149–173. https://doi.org/10.17533/UDEA.RC.332828.
Magno Cutipa-Limache, A., Escobar-Mamani, F., Anchapuri, M., Nacional, U., & Arguedas, J. M. (2020). A intensidade da inovação e a competitividade das micro e pequenas empresas exportadoras de artesanato têxtil. Revista EAN, 89, 155–176. https://doi.org/10.21158/01208160.N89.2020.2848.
Manda, J., Khonje, M. G., Alene, A. D., Tufa, A. H., Abdoulaye, T., Mutenje, M., Setimela, P., & Manyong, V. (2020). Does cooperative membership increase and accelerate agricultural technology adoption? Empirical evidence from Zambia. Technological Forecasting and Social Change, 158(1), 120160. https://doi.org/10.1016/J.TECHFORE.2020.120160.
Marcela Maestre Matos, L., Paola Páez Cabas, A., Javier Mesías, F., & Lombana Coy, J. (2019). Las cooperativas agrarias como modelo generador de negocios con inclusión social: el caso de las cooperativas bananeras del Magdalena (Colombia). REVESCO. Revista de Estudios Cooperativos, Nº 132, pp. 195–217. https://doi.org/10.5209/REVE.65488.
Maroco, J., & Garcia-Marques, T. (2006). Qual a fiabilidade do alfa de Cronbach? Questões antigas e soluções modernas? Laboratório de Psicologia, 4(1), 65–90. https://doi.org/10.14417/LP.763.
Martínez Arroyo, J. A., Jiménez Valenzo, M. A., & Zamudio de la Cruz, A. G. (2019). The management of the value chain in a competitive and changing environment. SIGNOS-Investigación En Sistemas de Gestión, 11(1), 55–70. https://doi.org/10.15332/s2145-1389.2019.0001.03.
Mendivelso, F. (2021). Prueba no paramétrica de correlación de Spearman. Revista Médica Sanitas, 24(1). https://doi.org/10.26852/01234250.578.
MIDAGRI. (2022). Boletin anual. Datos y Estadísticas. https://siea.midagri.gob.pe/portal/publicacion/boletines-anuales.
Minten, B., Dereje, M., Engida, E., & Kuma, T. (2019). Coffee value chains on the move: Evidence in Ethiopia. Food Policy, 83, 370–383. https://doi.org/10.1016/J.FOODPOL.2017.07.012.
Moreno Castillo, D. C., Grimaldo León, G. E., & Salamanca Molano, M. C. (2018). El Mapa de la Cadena de Valor como herramienta de diagnóstico de sistemas productivos. Caso: Línea de producción láctea. Espacios, 39(3).
Moyano, J., Puig, F., & Bruque, S. (2008). Los determinantes de la competitividad en las cooperativas. CIRIEC-España, Revista de Economía Pública, Social y Cooperativa, 61(1), 233–249.
Nahuamel, E. (2018). Factores competitivos para el desarrollo de la caficultura peruana. Pensamiento Crítico, 23(02), 97–114. https://doi.org/http://dx.doi.org/10.15381/pc.v23i2.15806.
Ordóñez, Dra. C. A. I. G. (2017). La gestión ambiental en la competitividad de las Pymes. Revista Científica Agroecosistemas, 5(1), 60–70.
Ortiz Pinilla, J., Felipe, A., & Rico, O. (2021). ¿Pearson y Spearman, coeficientes intercambiables? Comunicaciones En Estadística, 14(1), 53–63. https://doi.org/10.15332/23393076.6769.
Oviedo, H. C., & Campo-Arias, A. (2005). Aproximación al uso del coeficiente alfa de Cronbach. Revista Colombiana de Psiquiatría, 34(4), 572–580.
Pedersen, S., Zhang, T., Zhou, Y., Aschemann-Witzel, J., & Thøgersen, J. (2022). Consumer Attitudes Towards Imported Organic Food in China and Germany: The Key Importance of Trust. Journal of Macromarketing. https://doi.org/10.1177/02761467221077079.
Peña, Y., Andrea, P., Alemán, N., Díaz Rodríguez, F., Peña, Y., Alemán, P. A. N., & Díaz Rodríguez, F. (2008). Cadenas de valor: un enfoque para las agrocadenas. Equidad y Desarrollo, 1(9), 77–85. https://doi.org/https://doi.org/10.19052/ed.279.
Perdigón Llanes, R. (2020). Estrategia digital para fortalecer la gestión comercial de las cooperativas agropecuarias cubanas. Cooperativismo y Desarrollo, 8(1), 33–44.
Porter, M. E., & Linde, C. van der. (1997). Medio ambiente y competitividad. Oikos, 10, 61–75.
Pulido, A., & Klein, I. L. R. (2005). Productividad, competitividad e Innovación Primer mandamiento: mejorar la productividad.
Quispe, L. M. (2022). Gestión empresarial y desarrollo sostenible de las cooperativas agrarias cafetaleras en el Perú: caso Cajamarca. Gestión En El Tercer Milenio, 25(50), 71–79. https://doi.org/10.15381/gtm.v25i50.24283.
Ramírez Molina, R. I., Ríos-Pérez, J. D., Lay Raby, N. D., & Ramírez Molina, R. J. (2021). Estrategias empresariales y cadena de valor en mercados sostenibles: Una revisión teórica. Revista de Ciencias Sociales, 27 (Especial 4), 147–161. https://doi.org/10.31876/rcs.v27i.36999.
Restrepo, L. F., Julián González L.; Est, E., & Bioma, E. (2007). SELECCIONES De Pearson a Spearman From Pearson to Spearman.
Rodríguez Miranda, A. (2021). Contribución de las cooperativas agrarias al desarrollo territorial en Uruguay. Cooperativismo & Desarrollo, 29(119), 1–31. https://doi.org/10.16925/2382-4220.2021.01.02.
Rodríguez-Rodríguez, J., & Reguant-Álvarez, M. (2020). Calcular la fiabilitat d’un qüestionari o escala mitjançant l’SPSS: el coeficient alfa de Cronbach. REIRE Revista d’Innovació i Recerca En Educació, 13(2), 1–13–1–13. https://doi.org/10.1344/REIRE2020.13.230048.
Scuderi, A., La Via, G., Timpanaro, G., & Sturiale, L. (2022). The Digital Applications of “Agriculture 4.0”: Strategic Opportunity for the Development of the Italian Citrus Chain. Agriculture, 12(3), 400. https://doi.org/10.3390/AGRICULTURE12030400.
Sexton, R. J., & Iskow, J. (2021). The Competitive Role of Cooperatives in Market-Oriented Economies: A Policy Analysis. In Agricultural Cooperatives in Transition (1st Edition, pp. 55–83). Routledge. https://doi.org/10.4324/9780429041693-5.
Silva, P., Boaventura, M., Abdalla, C. C., Lobo, C., Sarkis Arakelian, J., Heck, M., Pilcher, J., Ray, K., Brito, E., Carla, |, Abdalla, C., José, A. |, & Arakelian, S. (2018). Value co-creation in the specialty coffee value chain: the third-wave coffee movement. Revista de Administração de Empresas, 58(3), 254–266. https://doi.org/10.1590/S0034-759020180306.
Swisher, M. E., Ruiz-Menjivar, J., & Koenig, R. (2018). Value chains in renewable and sustainable food systems. Renewable Agriculture and Food Systems, 33(1), 1–5. https://doi.org/10.1017/S1742170517000667.
Valenzuela Antezana, R. N., & Luna-Mercado, G. I. (2023). Effect of processing methods (washed, honey, natural, anaerobic) of catimor coffee on physical and sensory quality in Alto Inambari, Peru. Coffee Science - ISSN 1984-3909, 18, e182111–e182111. https://doi.org/10.25186/.V18I.2111.
Van Tran, A. T., & Nguyen, N. T. (2021). Organic food consumption among households in hanoi: Importance of situational factors. Sustainability (Switzerland), 13(22). https://doi.org/10.3390/SU132212496.
Venus, T. E., Beale, C., & Villalba, R. (2024). Innovation and Networks in the Bioeconomy: A Case Study from the German Coffee Value Chain. Circular Economy and Sustainability, 1–22. https://doi.org/10.1007/s43615-024-00357-7.
Vicente-Herrero, M. T., Delgado-Bueno, S., Bandrés-Moyá, F., Ramírez-Iñiguez-de-la-Torre, M. V., Capdevilla-García, L., Vicente-Herrero, M. T., Delgado-Bueno, S., Bandrés-Moyá, F., Ramírez-Iñiguez-de-la-Torre, M. V., & Capdevilla-García, L. (2018). Valoración del dolor. Revisión comparativa de escalas y cuestionarios. Revista de la Sociedad Española del Dolor, 25(4), 228–236. https://doi.org/10.20986/RESED.2018.3632/2017.
Vicol, M., Neilson, J., Hartatri, D. F. S., & Cooper, P. (2018). Upgrading for whom? Relationship coffee, value chain interventions and rural development in Indonesia. World Development, 110, 26–37. https://doi.org/10.1016/J.WORLDDEV.2018.05.020.
Vivar-Astudillo, A. Y., Erazo-Álvarez, J. C., & Narváez-Zurita, C. I. (2020). La cadena de valor como herramienta generadora de ventajas competitivas para la Industria Acuícola. Revista Arbitrada Interdisciplinaria Koinonía, 5(10), 4–33. https://doi.org/10.35381/r.k.v6i10.686.
Zhang, S., Sun, Z., Ma, W., & Valentinov, V. (2020). The effect of cooperative membership on agricultural technology adoption in Sichuan, China. China Economic Review, 62(1), 101334. https://doi.org/10.1016/J.CHIECO.2019.101334.
Zheng, Y., Yu, X., Yang, H., & Wang, S. (2019). From a perspective of nutrition: Importance of organic foods over conventional counterparts. In Safety and Practice for Organic Food (pp. 75–134). Elsevier. https://doi.org/10.1016/B978-0-12-812060-6.00005-2.